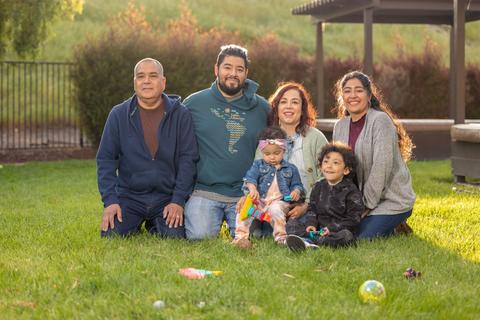
Santa Clara County Latino Health Brief
Santa Clara County (“county”) was built upon the existence and contributions of Latino populations. A longstanding history of prominent Latino leadership, community organizing and advocacy, and a vibrant presence of cultural arts and cuisine has significantly shaped the Santa Clara Valley landscape. However, structural racism and historical practices have disproportionately impacted Latino individuals and families, including neighborhood, institutional, and economic inequities, as well as the resulting health disparities. This Health Brief provides an overview of factors that impact Latino health, highlighting select health outcomes and service utilization among Latino populations, including steps the county is taking to advance health and well-being in the Latino community.
Land Acknowledgement
The County of Santa Clara is located on the ancestral land of the Muwekma Ohlone Tribe. The County of Santa Clara’s Public Health Department wishes to continue to acknowledge the colonization and stolen land of the territory and honor the sovereignty and traditional Muwekma Ohlone Tribe’s land. This land provides bountiful resources and richness that the Muwekma Ohlone People stewarded for many years. As a Public Health Department, we acknowledge and stay committed to the visibility of this history. In alignment with the Public Health Department’s commitment to racial and health equity, our understanding of the long-standing history and current experiences of Native and Indigenous people helps inform our current and future work through an equity lens. By being centered on equity and an understanding of the historical context, we hope to honor and make visible the past, present, and future Native Nations.
Demographics and Geography
In 2021, Latinos represented the third largest racial/ethnic group in the county, constituting a quarter (25%) of the county’s residents1. Projections indicate that the Latino population in the county will remain stable at approximately 25% through 20602. The Latino population is among the youngest in the county, with 28% under age 18, and only 8% over age 651.
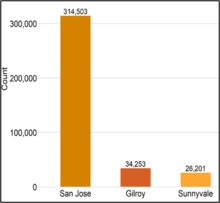
Latinos live in every city in the county. Gilroy has the highest proportion of Latino residents (58%). San José had the highest number of Latino residents with 314,503 Latinos, constituting 31% of the city’s population1.
Countywide, approximately 32% of Latino residents were immigrants from other countries. Most Latino immigrants were from Mexico (78%), with smaller percentages coming from El Salvador (5%); Guatemala (3%); Colombia (2%); and Peru (2%)1.
Of all Latino immigrants living in the county, 13% reported entering the United States in the year 2000 or later. This suggests that most foreign-born Latinos in the county have been in the United States for more than 20 years3. Furthermore, there are approximately 134,000 undocumented immigrants living in the county4. An estimated 44% of the undocumented community in the county was born in Mexico5.
Santa Clara County cities and places with the highest proportion of Latino residents1
Santa Clara County cities with the highest number of Latino residents1
Strengths and Resiliency in the Latino Community
Despite historical trauma, racial discrimination, and structural inequities, the Latino community draws on a wealth of strengths that protect against the negative effects of adversity on their well-being. Optimism, bilingualism, and family cohesion and support are a few examples of such strengths in the Latino community6. The importance of family connectedness is one factor that promotes health among many Latinos. Familismo or familism is a cultural value frequently seen in Latino culture and emphasizes supporting and respecting the family unit. Familismo plays a role in Latinos navigating mental health problems and may foster the growth and healthy development of children7. It also provides supportive and caring relationships for family members and the community at large, particularly for taking care of children and elderly members6 8 9.
Beyond familismo, Latinos in the county also experience other positive health outcomes and health behaviors. For example, in 2021, Latino mothers in the county gave birth to fewer babies that were low birthweight (7%) compared to other racial/ethnic groups in the county10. Also, during 2017-2021, teenage and adult Latinos in the county had the second lowest percentage (46%) of ever using marijuana, with Asians experiencing the lowest percentage11.
Factors Influencing Latino Health
Health and well-being are largely shaped by the conditions in which individuals are born, grow, work, live and age12 13 14. Such conditions are called social determinants of health and include factors such as social inclusion and non-discrimination, access to high-quality education, income, wealth, safe housing, access to nutritious foods, affordable healthcare, transportation, and systems of social and emotional support12 14 15. These social determinants of health are often interrelated and worsened by the cumulative effects of each other. The following sections highlight how the Latino community are impacted by some key social determinants of health.
Education
The level of education someone receives has an impact on how healthy they are16.
Latino adults in the county with less than a high school education reported fair or poor health more often (31%) than those with higher education (16%)11. During 2021-2022, Latino students in the county had a lower percentage of high school graduation (79%) compared to other racial/ethnic groups and compared to the county overall (89%)17. Similarly, Latinos in the county had a lower percentage of adults ages 25 years and over with at least a bachelor’s degree (21%) compared to other racial/ethnic groups and the county overall (55%)1.
Housing and Neighborhood Conditions
Overall well-being is significantly influenced by the neighborhood, such as the availability of grocery stores, prevalence of violence, exposure to environmental hazards like air and noise pollution, accessibility to parks, availability of public transportation, and a sense of feeling safe18 19. National surveys indicate that Latino adults who perceived their neighborhoods as “safe from crime” were less likely to have chronic health issues20.
During 2017-2021, a lower percentage of Latinos in the county reported feeling safe in their neighborhood (81%) compared to the county overall (91%)11.
Neighborhood gentrification also influences health outcomes21 22. Gentrification may lead to the displacement of lower income residents who can no longer afford to live in the area. Gentrification may also drive up housing costs, disrupt established social networks, and exacerbate health inequities. Consequences of gentrification and increased cost of living may cause over-crowded living situations as more family members and friends live together to afford housing23. Gentrification may also lead renters to move away from their gentrifying neighborhoods24. In 2020, thirty-one percent (31%) of Latino households within the county resided in neighborhoods that were at-risk of gentrification or currently gentrifying22.
Incarceration
Individuals who are incarcerated are more likely to have high blood pressure, asthma, cancer, arthritis, and infectious diseases such as tuberculosis, hepatitis C, and HIV25. Furthermore, children with a parent or guardian who has served time in jail or prison are more likely to live in poverty, experience homelessness, and witness domestic violence26. While the overall population of individuals incarcerated in the county’s jail system is declining, Latinos continue to be over-represented in the jail population. In 2022, Latinos represented 57% of the annual average adult population incarcerated in the Elmwood Men’s Facility or the Santa Clara County Main Jail Complex27.
Income and Economic Stability
Health is impacted by income, the type of job worked, workplace conditions, and job security19.
Jobs in management, business, science, and art tend to have higher salaries and the ability to work remotely1. During 2017-2021, a lower percentage of Latinos in the county ages 16 and over held these types of positions (26%) compared to other racial/ethnic groups and the county overall (57%). Latinos in the county had the lowest per capita average income ($31,662) in comparison to other racial/ethnic groups and the county overall ($65,052). A higher percentage of Latino families in the county lived in poverty (7%) compared to other race/ethnicity groups and the county overall (4%)3. Additionally, the unemployment rate among Latinos ages 16 years and over stood at 4.8% in 2022, higher than the county overall percent of 3.8%1.
A household is considered burdened with household costs when it spends more than 30% of its income on rent and utilities28. During 2017-2021, over half of Latino households in the county (57%) spent more than 30% of their income on rent compared to 45% countywide3. This financial strain often means there is not enough money to cover essentials like nutritious foods or healthcare. This economic burden is linked to increased stress, mental health conditions, and an increased risk of disease29.
Access to home ownership is critical for Latinos’ wealth-building opportunities. Wealth is an indicator of economic security because it helps families manage unexpected costs, pay for higher education, and save for retirement30. In 2022, 19% of housing in the county were occupied by Latino households. Thirty-three percent (33%) of those Latino-occupied housing units were owned by the residents and 67% were rented by the residents. This is in contrast to the county overall, where more housing units are occupied by their owners (54%) compared to being occupied by renters (46%)1`.
Access to Healthcare and Insurance Coverage
Many people face barriers that prevent or limit access to needed health care services, which may increase the risk of poor health outcomes and health disparities31.
During 2017-2021, Latinos in the county had the highest percentage of uninsured people (9%) compared to other racial/ethnic groups and the overall county percentage (4%)3. Furthermore, a higher percentage of Latinos in the county (12%) experienced gaps in insurance or lacked insurance at some time in the past year, compared to other racial/ethnic groups. A greater proportion of Latino adults in the county reported cost or lack of insurance as reasons for delayed or forgone medical care (43%) compared to other racial/ethnic groups and the county overall (31%)11.
A usual source of healthcare is a place or healthcare professional that an individual or family usually visits when sick or in need of advice about health. Examples of a usual source of care include a primary care physician, or a facility such as a physician group practice32. Having a usual source of care is associated with better overall health outcomes33.
A higher percent of Latino adults in the county reported not having a usual place of care (13%) compared to other racial/ethnic groups and the county overall (10%). Among Latinos in the county, the percent without usual place of care was higher among those without health insurance (41%) compared to those with health insurance (12%)11.
Key Concerns Among the Latino Community
Adverse health outcomes among Latinos can be better understood within the context of the social determinants of health experienced by the community. This section highlights some health outcomes where Latinos are disproportionately impacted.
Mental Health
Mental health includes emotional, psychological, and social well-being. Mental illnesses are among the most common health conditions in the United States, with more than 1 in 5 adults living with a mental illness34. The COVID-19 pandemic exacerbated risk factors for mental health illnesses, resulting in a 25% increase in the prevalence of anxiety and depression worldwide35 36.
During 2017-2021, nearly 16% of Latino adults in the county reported experiencing serious psychological distress in the past year, compared to nearly 11% of all adults in the county. Furthermore, 25% of Latino adults reported that their social life was affected by mental illness, compared to 19% of the county overall. Seventeen percent (17%) of Latino adults reported having serious suicidal ideation, compared to 14% of the county overall11. Seventeen percent (17%) of Latino adults also reported visiting a professional for mental health, drug, or alcohol issues at least once in the past year11. However, this may be an underestimate of the proportion of the Latino community that may benefit from mental health services. Barriers to accessing mental health services among Latinos include lack of culturally and linguistically appropriate services, limited access to healthcare and lower quality of care, and perceived mental health stigma contributing to hesitancy in seeking help37 38 39 40.
Reported psychological distress among adults in the past year in Santa Clara County, 2017 - 202111
COVID-19
COVID-19 had a particularly severe impact on health inequities in the Latino community. Factors such as working in a job considered essential, overcrowded living situations, and limited English proficiency increased the risk for COVID-19 infection among Latinos41. In California, Latinos were 8.1 times more likely to live in a “high-exposure household” compared to other racial/ethnic groups. These are households where there is at least one essential worker or where there are more people than the number of bedrooms in the home42.
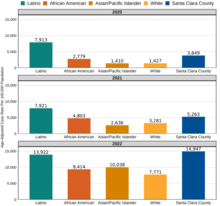
From 2020 to 2022, Latinos in the county consistently experienced the highest COVID-19 case rate compared to other racial/ethnic groups. The case rate among Latinos was the highest in 2022 at 13,922 cases per 100,000 population.
COVID-19 case rates in Santa Clara County, 2020 - 20223 43
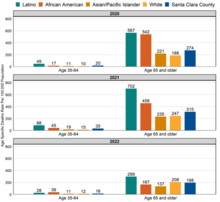
COVID-19 death rates among Latinos were higher regardless of the age of those who died. Latinos had the highest rate of COVID-19 deaths per 100,000 population across all age groups and all three years, compared to other racial/ethnic groups, except for those ages 35 to 64 in 2022.
COVID-19 death rates in Santa Clara County, 2020 – 20223 10 43
Note: COVID-19 deaths among age 0-34 group were excluded from the graph due to small sample size.
Beyond the direct impact of COVID-19 cases and deaths, Latinos experienced enduring social and economic impacts from the pandemic. For example, food insecurity concerns across the country increased particularly among Latino households where the heads of households lost their jobs because of the COVID-19 pandemic and where English proficiency among adults was limited44. During 2020-2021, Latinos in the county reported more experiences of reduced work hours, job loss, or difficulty paying for their mortgage during the pandemic, compared to other racial/ethnic groups11. Focus groups conducted between August 2022 – January 2023 among Spanish and Vietnamese residents of East San Jose, Gilroy and Mountain View indicated that significant recovery from the COVID-19 pandemic is still needed. Latinos continue to face economic hardship, challenges obtaining aid, and difficulty accessing healthcare and mental health care in the wake of the COVID-19 pandemic45.
Diabetes
Diabetes remains a significant health issue and concern among Latinos. Latinos have a higher risk of being diagnosed with diabetes compared to other racial/ethnic groups46. This increased risk is influenced by various social determinants of health, including access to healthy foods, education attainment, healthcare access, and access to environments that promote physical activity46. In addition, developing diabetes at a younger age increases the risk for diabetes-related complications, lower quality of life and premature death than developing the diabetes at a later age46.
During 2017-2021, a larger proportion of Latinos in the county had diabetes (10%) compared to the proportion among the county population (8%). Furthermore, a higher percent of Latinos in the county reported being diagnosed with diabetes before 40 years old (36%) compared to the county overall (21%)11. During 2017-2021, the rate of diabetes-related emergency department visits in the county was higher among Latinos (3,647 per 100,000 population) than the county overall (1,742 per 100,000 population)47. These higher emergency department visit rates are likely influenced by factors such as lack of routine preventive care, delayed medical care, linguistic barriers, lack of cultural competency, and problems navigating the healthcare system in addition to disparities in actual diabetes diagnoses48 49.
Latinos Utilizing Services Provided by the County of Santa Clara
The County of Santa Clara provides a variety of health and social services. These services are provided in partnership with community health centers and other community-based organizations that have cultural expertise and/or are geographically located to enhance accessibility of services. The following section outlines various services utilized by Latinos in the county.
Public Assistance Programs
The county’s most vulnerable communities benefit from county services that support the costs of daily living.
In 2022, Latinos represented the largest racial/ethnic group newly enrolled in the county’s CalWORKs (41%); CalFresh (30%); and Medi-Cal (27%) programs. Latinos also represented 18% of all newly enrolled individuals into the General Assistance program, second highest compared to Whites (23%)50. Latinos also represented 65% of individuals receiving WIC (Women, Infants and Children) services and benefits51.
Healthcare and Behavioral Healthcare Services
Safety net healthcare services are offered by several entities throughout the county. One major safety net health care service provider is the County of Santa Clara Healthcare System (CSCHS), which provides healthcare to people in the county regardless of their socio-economic status and ability to pay.
In 2022, Latinos represented more than half of CSCHS patients accessing the system’s primary care services (54%), inpatient services (50%) and emergency department services (58%) within Santa Clara Valley Medical Center, O’Connor Hospital and St. Louise Regional Hospital52.
CSHCS also provides healthcare services to individuals who are in custody. In 2022, Latinos represented 57% of the annual average adult population incarcerated in the Elmwood Men’s Facility or the Santa Clara County Main Jail Complex53. In that year, 55% of individuals accessing Custody Health services were Latino54.
The County of Santa Clara Primary Care Assistance Program (PCAP) is a health coverage program for low-income, uninsured adults living in Santa Clara County. This program provides primary health care services through community health centers. Between July 1, 2019, and June 20, 2020, there were 5,073 enrollees in the PCAP program. Of those, 56% of the PCAP enrollees were Latino55.
Another source of safety net health care is community clinics. For decades, local nonprofit community health centers and clinics have worked with the County of Santa Clara to provide a coordinated system of affordable, accessible, and culturally competent health care services to a widely diverse population of under-resourced patients. The centers provide services such as: integrated behavioral health, specialty mental health, nutrition education, alcohol and drug recovery, diabetes self-management, navigation, and enrollment. Between July 1, 2019, and June 20, 2020, 3,761 PCAP enrollees received services from nonprofit community health centers55. Latinos also seek healthcare services offered by other sources, such as Medi-Cal and Fee for Service programs.
The County of Santa Clara Behavioral Health Services Department (BHSD) and its contracted service providers offer mental health and substance use treatment services for the county’s most vulnerable community members. In 2022, Latinos represented more than half of BHSD clients receiving mental health services (52%) and substance use disorder services (59%)56.
School Linked Services Family Engagement Program is administered by the BHSD in partnership with 23 of the county’s school districts to provide students and families with school-based coordinated services to improve health and wellbeing of families. From July 2022 – June 2023, a total of 6,634 students received School Linked Services across the 23 school districts. Among those, 71% of students receiving School Linked Services were Latino57.
Next Steps for Shaping a Healthier Latino Community in Santa Clara County
It is crucial to recognize that the data in this health brief provide only a partial picture of the inequities faced by the Latino community in the county. To gain a deeper and more holistic understanding of Latino health, the county needs to actively engage and listen to the diverse perspectives, lived experiences, stories, and insights from Latino community members. Their stories and narrative bring valuable context and nuance to these data, and help us comprehend the complexities, challenges, and strengths in the community.
The mission of the Public Health Department is for all people to thrive in healthy and safe communities. To carry out this mission, the Public Health Department must ensure that all racial/ethnic groups in the county can thrive and reach their best health. In partnership with community stakeholders, the Public Health Department is embarking on a comprehensive assessment to identify the root causes of health inequities among Latinos. This assessment represents a commitment to authentic community engagement and inclusivity, recognizing that solutions must be co-created with those most affected by the issues.
In addition to diving deeper into the data outlined in this health brief, this assessment will also explore the enduring impacts of colonialism, genocide, intergenerational trauma, as well as the systemic, structural, and institutional inequities that perpetuate racial and health inequities among Latinos. Assessment findings will be translated into a clear and actionable blueprint or action plan for meaningful change.
Updates on the Latino Health Assessment will be provided here: sccphd.org/LatinoHealth.
1 U.S. Census Bureau, 2021 American Community Survey 1-Year Estimates.
2 State of California, Department of Finance. Report P-2A Total Population for California and Counties (2020-2060).
3 U.S. Census Bureau, 2017-21 American Community Survey 5-Year Estimates.
4 The County of Santa Clara, Office of Immigrant Relations, Division of Equity & Social Justice. FY 2022 Annual Report.
5 Migration Policy Institute. Profile of the Unauthorized Population: Santa Clara County, CA. Available from: https://www.migrationpolicy.org/data/unauthorized-immigrant-population/county/6085
6 National Research Center on Hispanic Children & Families. Latinx Families’ Strengths and Resilience Contribute to Their Well-being. Available from: https://www.hispanicresearchcenter.org/research-resources/latinx-families-strengths-and-resilience-contribute-to-their-well-being/
7 Valdivieso-Mora E, Peet CL, Garnier-Villarreal M, et al. A systematic review of the relationship between familism and mental health outcomes in Latino population. Front. Psychol. 2016; 7:1632. doi: 10.3389/fpsyg.2016.01632
8 Suicide Prevention Resource Center. Risk and Protective Factors: Hispanic Populations. Available from: https://sprc.org/wp-content/uploads/2023/01/Risk-and-Protective-Factors-Hispanic_0.pdf
9 Marin MR, Vazquez EG. The intersection of family and community resilience to enhance mental health among Latino children, adolescents, and families. APA News. Available from: https://www.apa.org/pi/families/resources/newsletter/2012/07/family-community
10 California Integrated Vital Records System (Cal-IVRS), 2012-2022, data retrieved July 20, 2023.
11 UCLA Center for Health Policy Research. California Health Interview Survey, 2017-2021.
12 World Health Organization. Social Determinants of Health. Available from: https://www.who.int/health-topics/social-determinants-of-health#tab=tab_1
13 Committee on Educating Health Professionals to Address the Social Determinants of Health; Board on Global Health; Institute of Medicine; National Academies of Science, Engineering and Medicine. A Framework for Educating Health Professional to Address the Social Determinants of Health. Washington (DC): National Academies Press (US); 2016 Oct 14. 3, Frameworks for Addressing the Social Determinants of Health. Available from: https://www.ncbi.nlm.nih.gov/books/NBK395979/
14 Bay Area Regional Health Inequities Initiative. BARHII Framework. Available from: Framework — BARHII - Bay Area Regional Health Inequities Initiative
15 Committee on Educating Health Professionals to Address the Social Determinants of Health; Board on Global Health; Institute of Medicine; National Academies of Science, Engineering and Medicine. A Framework for Educating Health Professional to Address the Social Determinants of Health. Washington (DC): National Academies Press (US); 2016 Oct 14. 3, Frameworks for Addressing the Social Determinants of Health. Available from: https://www.ncbi.nlm.nih.gov/books/NBK395979/
16 Zajacova A, Lawrence EM. The Relationship Between Education and Health: Reducing Disparities Through a Contextual Approach. Annu Rev Public Health. 2018; 39:273-289. doi: 10.1146/annurev-publhealth-031816-044628
17 California Department of Education, Data Quest, 2021-2022
18 Taylor LA. Housing and Health: An Overview of the Literature. Health Affairs Brief: Culture of Health. 2018. Available from: https://www.healthaffairs.org/do/10.1377/hpb20180313.396577/
19 O'Neill Hayes T, Delk R. Understanding the Social Determinants of Health. American Action Forum. 2018. Available from: https://www.americanactionforum.org/research/understanding-the-social-determinants-of-health/
20 Budd EL, Giuliani NR, Kelly NR. Perceived Neighborhood Crime Safety Moderates the Association Between Racial Discrimination Stress and Chronic Health Conditions Among Hispanic/Latino Adults. Front Public Health. 2021;9:585157. doi: 10.3389/fpubh.2021.585157
21 https://www.ncbi.nlm.nih.gov/pmc/articles/PMC7704880/ Smith GS, Breakstone H, Dean LT, Thorpe RJ Jr. Impacts of Gentrification on Health in the US: a Systematic Review of the Literature. J Urban Health. 2020:97(6):845-856. doi: 10.1007/s11524-020-00448-4.
22 Bay Area Equity Atlas. Gentrification risk: Low-income residents should be able to stay and benefit when new investment comes to their neighborhoods. 2020. Available from: https://bayareaequityatlas.org/indicators/gentrification-risk
23 https://www.healthaffairs.org/do/10.1377/hpb20200724.106767/ Ellen IG, Captanian A. Gentrification and The Health of Legacy Residents. Health Affairs Brief: Culture of Health. 2020. Available from: https://www.healthaffairs.org/do/10.1377/hpb20200724.106767/
24 Martin IW, Beck K. How Does Gentrification Affect Homeowners and Renters Differently? Urban Affairs Review. 2017. Available from: https://housingmatters.urban.org/research-summary/how-does-gentrification-affect-homeowners-and-renters-differently
25 https://health.gov/healthypeople/priority-areas/social-determinants-health/literature-summaries/incarceration U.S. Department of Health and Human Services, Office of Disease Prevention and Health Promotion. Social Determinants of Health Literature Summaries: Incarceration. Healthy People 2030.
26 U.S. Department of Health and Human Services, Office of Disease Prevention and Health Promotion. Objectives: Social and Community Context: Reduce the proportion of children with a parent or guardian who has served time in jail or prison – SDOH‑05. Health People 2030.
27 Criminal Justice Information Control, data retrieved July 19, 2023.
28 National Low Income Housing Coalition. The Gap. A Shortage of Affordable Homes. 2023. The Gap Report.
29 U.S. Department of Health and Human Services, Office of Disease Prevention and Health Promotion. Reduce the Proportion of families that spent more than 30 percent of income on housing – SDOH-04. Health People 2030.
30 UnidosUS. Housing Inequities Latinos are Facing in California. Fact Sheet.
31 U.S. Department of Health and Human Services, Office of Disease Prevention and Health Promotion. Social Determinants of Health Literature Summaries: Access to Health Services. Healthy People 2030.
32 Lee DC, Shi L, Wang J. Usual source of care and access to care in the US: 2005 vs. 2015. PLoS One. 2023; 18(1): e0278015. doi: 10.1371/journal.pone.0278015
33 County Health Rankings & Roach Maps. Access to Care. Available from: https://www.countyhealthrankings.org/explore-health-rankings/county-health-rankings-model/health-factors/clinical-care/access-to-care
34 Centers for Disease Control and Prevention. About Mental Health. Available from: https://www.cdc.gov/mentalhealth/learn/index.htm
35 Moreno C, Wykes T, Galderisi S, et al. How mental health care should change as a consequence of the COVID-19 pandemic. LANCET PSYCHIAT. 2020; 7(9):813-824. doi: 10.1016/S2215-0366(20)30307-2.
36 World Health Organization (WHO). COVID-19 pandemic triggers 25% increase in prevalence of anxiety and depression worldwide. WHO, March 2, 2022, https://www.who.int/news/item/02-03-2022-covid-19-pandemic-triggers-25-increase-in-prevalence-of-anxiety-and-depression-worldwide. Accessed August 24, 2023.
37 Substance Abuse and Mental Health Services Administration (SAMHSA). Behavioral Health Equity: Hispanic/Latino. SAMHSA, https://www.samhsa.gov/behavioral-health-equity/hispanic-latino. Accessed August 24, 2023.
38 Interian A, Ang A, Gara MA, et. al. Stigma and Depression Treatment Utilization Among Latinos: Utility of Four Stigma Measures. Psychiatry Online. 2010; 61(4): 373-379. doi: 10.1176/ps.2010.61.4.373
39 Gearing RE, Brewer KB, Washburn M, et al. Public Stigma Toward Schizophrenia Within Latino Communities in the United States. Community Ment Health J. 2023; 59(5):915-928. doi: 10.1007/s10597-022-01075-w.
40 Interian A, Martinez IE, Guarnaccia PJ, et al. A qualitative analysis of the perception of stigma among Latinos receiving antidepressants. Psychiatr Serv. 2007; 58(12):1591-4. doi: 10.1176/ps.2007.58.12.1591.
41 Salgado de Snyder VN, McDaniel M, Padilla AM, et al. Impact of COVID-19 on Latinos: A Social Determinants of Health Model and Scoping Review of the Literature. Hisp. J. Behav. Sci. 2021; 43(3), 174–203. doi:10.1177/07399863211041214.
42 Reitsma MB, Claypool AL, Vargo J, et al. Racial/Ethnic Disparities in COVID-19 Exposure Risk, Testing, and Cases at The Subcounty Level in California. Health Affairs: COVID-19, Equity & More. 2021; 40(6): 863-1014. doi:10.1377/hlthaff.2021.00098
43 California Reportable Disease Information Exchange (CalREDIE), data retrieved July 20, 2023
44 Salgado de Snyder VN, McDaniel M, Padilla AM, et al. Impact of COVID-19 on Latinos: A Social Determinants of Health Model and Scoping Review of the Literature. Hisp. J. Behav. Sci. 2021; 43(3), 174–203. doi:10.1177/07399863211041214
45 Community Health Partnerships. COVID-19 Community Resiliency & Recovery Efforts Report.
46 Cartwright K. Social determinants of the Latinx diabetes health disparity: A Oaxaca-Blinder decomposition analysis. SSM Popul. Health. 2021; 15: 100869. doi:10.1016/j.ssmph.2021.100869.
47 Department of Health Care Access and Information. 2017-21 Emergency Department Visits Data
48 Agency for Healthcare Research and Quality. Emergency Department Visits for Adults with Diabetes, 2010. https://hcup-us.ahrq.gov/reports/statbriefs/sb167.jsp
49 Uppal TS, Chehal PK, Fernandes G, et al. Trends and Variations in Emergency Department Use Associated with Diabetes in the US by Sociodemographic Factors, 2008-2017. JAMA Netw Open. 2022;5(5):e2213867. doi:10.1001/jamanetworkopen.2022.13867
50 California Statewide Automated Welfare Systems (CalSAWS), data retrieved July 19, 2023.
51 California WIC Reporting, Analytics and Data (WRAD), data retrieved July 19, 2023.
52 Santa Clara Valley Healthcare Electronic Medical Record System data, data retrieved July 20, 2023.
53 Criminal Justice Information Control, data retrieved July 19, 2023.
54 Santa Clara Valley Healthcare Electronic Medical Record System data, data retrieved July 20, 2023.
55 http://sccgov.iqm2.com/Citizens/Detail_LegiFile.aspx?ID=102367&highlightTerms=hospital demographics The County of Santa Clara. Report #102367: Receive report relating to the Primary Care Access Program (PCAP) for the remaining uninsured. 2020.
56 Behavioral Health Services Department Dashboard, data retrieved September 5, 2023
57 The County of Santa Clara. Report #117558: Receive report relating to the Primary Care Access Program (PCAP) for the remaining uninsured. 2023.


